
- DOGE’s volatility decreased, making it seem more stable than Bitcoin.
- DOGE’s historical volatility is 30%, lower than Bitcoin’s 35%.
- Bitcoin’s dominance rose to 50%, drawing liquidity from alternative cryptocurrencies like DOGE.
The level of volatility in dogecoin (DOGE), the leading meme cryptocurrency in terms of market value, has significantly decreased to the point where it appears to be more stable than bitcoin (BTC), the industry’s dominant digital asset. As per TradingView, the 30-day historical volatility for DOGE stands at 30% currently, which is notably lower than Bitcoin’s 35%. Historical volatility, in this context, is determined by calculating the standard deviation of the daily percentage price changes of an asset over a specified timeframe.
Historically, DOGE has exhibited higher volatility compared to Bitcoin, which has understandably deterred risk-averse investors. This discrepancy in volatility can be attributed to the fact that BTC has been in existence since 2009 and has matured into a macro asset, garnering increased institutional involvement over the last three years. In contrast, DOGE has been perceived as a less serious cryptocurrency project ever since its inception in 2013.
The recent reduction in volatility of the meme coin should not be misinterpreted as a sign of market maturity. Instead, it likely arises from a relative lack of investor interest in alternative cryptocurrencies.
Bitcoin’s dominance rate, which represents its share of the total cryptocurrency market, has climbed from approximately 40% earlier this year to 50%, indicating a significant flow of liquidity from alternative cryptocurrencies into Bitcoin. While the price of BTC has increased by 60% this year, data reveals that DOGE has experienced a decrease of just over 12% in its value.
This trend is reflected in key liquidity metrics such as the aggregate 1% market depth, which also reinforces this narrative. This metric assesses the total bids and asks within a 1% range of the mid-price across major cryptocurrency exchanges.
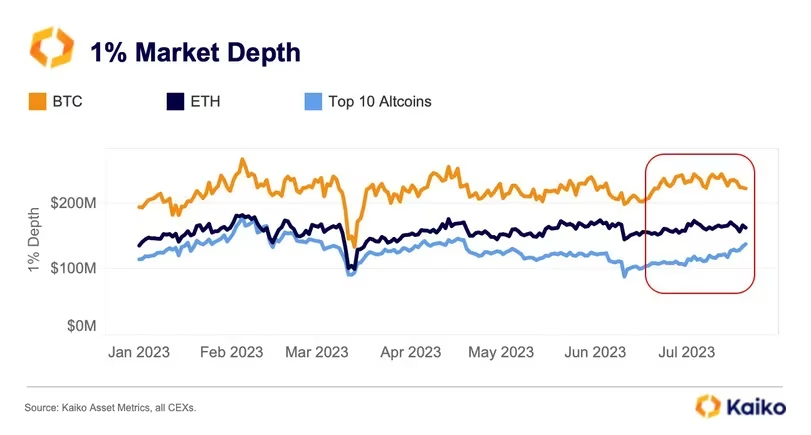
Data from Paris-based Kaiko reveals that, by the end of last month, the aggregate 1% market depth for the top 10 altcoins was notably lower compared to Bitcoin and Ether. This observation points to a broader trend of reduced market activity, as trading volumes in the spot market plummeted to a four-year low of $475 billion in August across the entire market. Spot trading volume on centralized exchanges has experienced a consecutive second-month decline, decreasing by 7.78% to $475 billion.
This marks the lowest trading volume level since March 2019, as reported by CCData, a digital assets data and index provider. Trading volume represents the total quantity of tokens that were exchanged within a specified timeframe.